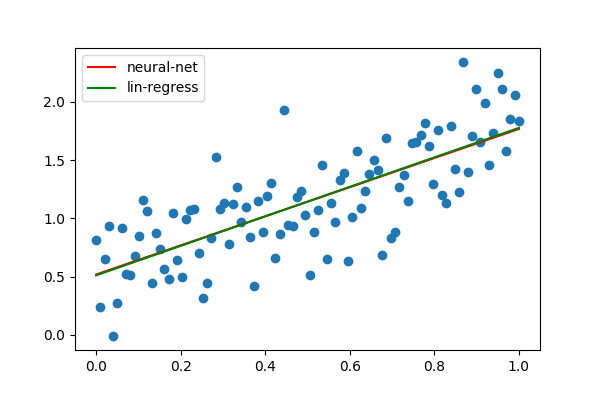
Here’s some stuff I have been working on.

DataCreator
A python app for drawing data

Creating a fake webcam
Intercepting the system's webcam and modifying the ouput using python

Use HTML canvas to create data
Using HTML5's canvas feature to create data with a specific linear relationship.

Google Analytics Dashbaord
Created a Dashbaord (as they are all the rage) using Google Data Studio to show the inbound traffic to my website.
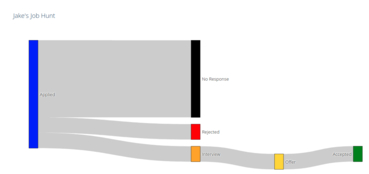
Interactive plot using plotly
During my job hunt I tracked my applications and plotted the progress using a sankey diagram
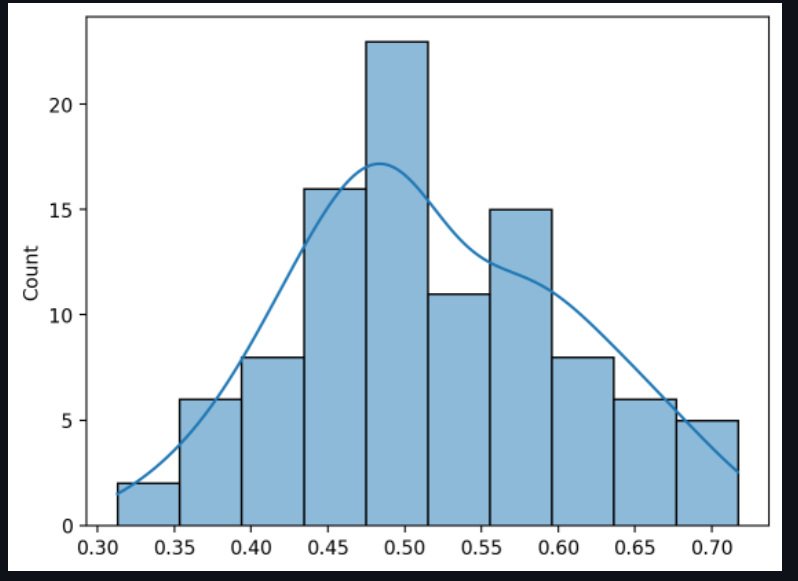
Host a webapp using Streamlit
Playing around with hosting webapps with streamlit.

Social Network Analysis of The Walking Dead
Using Graph theory to find out who is the protagonist of AMCs: Walking Dead
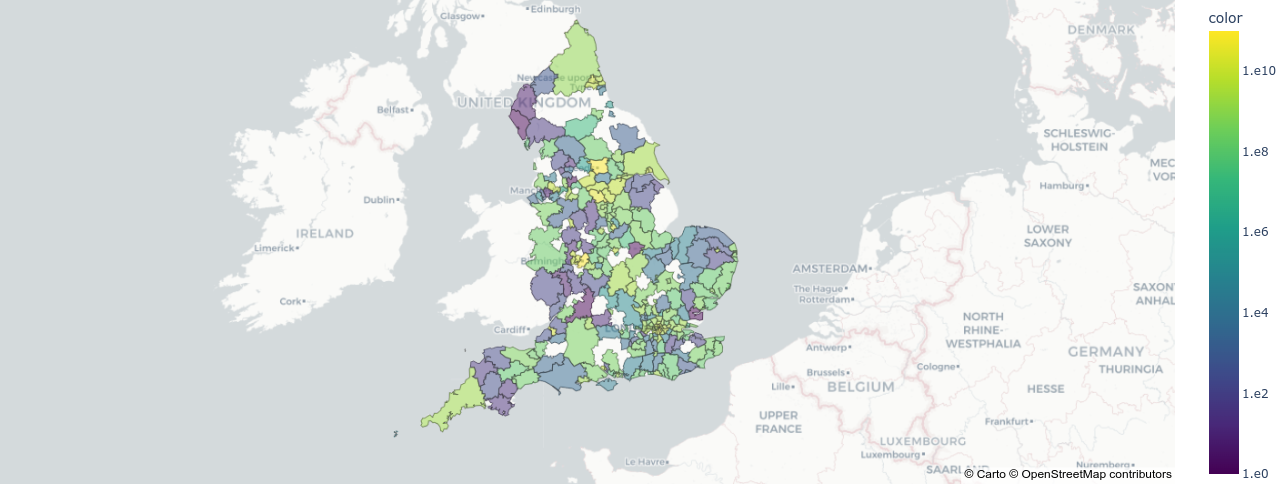
Visualisation of dwelling stock in the UK
Using a Chloropleth plot to display statistics for the UK's dwelling stock.
